Readiness for learning
The assessment of a child’s readiness for learning involves the combined consideration of children’s socio-emotional, cognitive and behavioural strengths and vulnerabilities and the individual literacy and numeracy skills the child brings to school.
This indicator is informed by the Australian Early Development Census (AEDC), formerly the Australian Early Development Index, which is a national measure on early childhood development.
Literacy and numeracy is discussed in the Transition to school indicator.
Good data is available on whether WA children are developmentally vulnerable.
Overview
School readiness is a multidimensional concept that incorporates children’s readiness for learning, school’s readiness for children and the capacity of families and the broader community to support children’s early learning and development.1
Research shows that ‘children entering school with basic skills for life and learning have higher levels of social competence and academic achievement, increasing their likelihood of achieving their full potential’.2
The AEDC can help measure how young children are developing across WA, and can assist communities and governments to target services, resources and support needed by young children and their families.3
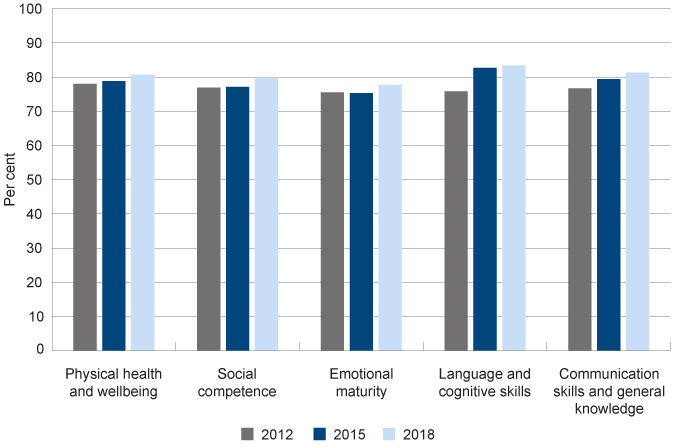
The proportion of WA children considered developmentally ‘on track’ as they enter full-time schooling has increased across all domains since 2012.
Children entering full-time school who are developmentally ’on-track’ by domain, per cent, WA, 2012, 2015 and 2018
Source: AEDC Data Explorer [online]
Areas of concern
Despite recent increases in the number of children who are developmentally on track, almost 20 per cent of WA children remain developmentally vulnerable on one or more domains when they start school.
Aboriginal children are more than twice as likely to be developmentally vulnerable on one or more domains as non-Aboriginal children (45.2% compared to 17.6%).
Similarly, children living in the lowest socioeconomic areas are twice as likely to be developmentally vulnerable on one or more domains as children living in higher socioeconomic areas (31.7% compared to 12.6%).
Endnotes
- Centre for Community Child Health 2008, Policy Brief 10: Rethinking School Readiness, Centre for Community Child Health.
- Australian Institute of Health and Welfare 2012, A picture of Australia’s children 2012, Cat No PHE 167, AIHW, p. 40.
- Department of Education 2016, Australian Early Development Census National Report 2015: A snapshot of Early Childhood Development in Australia, Commonwealth of Australia.
Last updated March 2020
The AEDC is a population-based measure of children’s development as they enter their first year of full-time school (Pre-primary in WA).1 The assessment takes place nationally every three years. Teachers complete the Early Development Instrument for each child in their class.2
The AEDC collects data relating to five key areas of early childhood development which are closely linked to child health, education and social outcomes. The five domains are physical health and wellbeing, social competence, emotional maturity, language and cognitive skills (school-based), and communication skills and general knowledge.
AEDC results are presented as the number and percentage of children who are developmentally on track, developmentally at risk and developmentally vulnerable in each domain.3 Further, two summary indicators are presented to show the percentage of children who are developmentally vulnerable on one or more domain(s) and developmentally vulnerable on two or more domains.
|
All children |
Aboriginal |
Non-Aboriginal |
Male |
Female |
|
|
WA |
19.4 |
45.2 |
17.6 |
25.3 |
13.4 |
|
Australia |
21.7 |
41.3 |
20.4 |
27.9 |
15.3 |
Source: Australian Early Development Census National Report 2018 and custom report from WA Department of Education [unpublished]
Note: Calculations are based on children with a valid AEDC score. WA had an overall participation rate of 99.3 per cent in 2018. Source: Social Research Centre 2019, 2018 AEDC Data Collection Technical Report, p. 70.
Results from the latest AEDC data collection (2018) show that the majority of WA children attending Pre-primary are considered ‘on track’ on each of the five developmental domains of the AEDC.
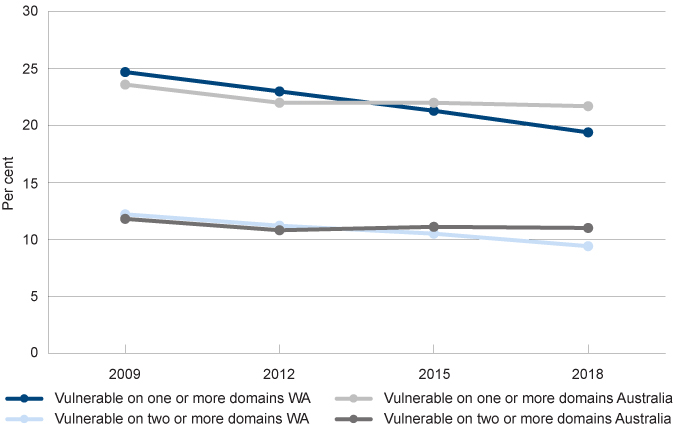
The percentage of children developmentally vulnerable on one or more domains of the AEDC at school entry was 19.4 per cent. This result is an improvement of the percentage reported in 2015 of 21.3 per cent and also the 2012 result of 23.0 per cent.
The percentage of WA children developmentally vulnerable on one or more domains in 2018 is slightly lower than the national average (19.4% compared to 21.7%).
|
2009 |
2012 |
2015 |
2018 |
||
|
Vulnerable on one or more domains |
WA |
24.7 |
23.0 |
21.3 |
19.4 |
|
Australia |
23.6 |
22.0 |
22.0 |
21.7 |
|
|
Vulnerable on two or more domains |
WA |
12.2 |
11.2 |
10.5 |
9.4 |
|
Australia |
11.8 |
10.8 |
11.1 |
11.0 |
|
Source: Australian Early Development Census National Report 2018 and custom report from WA Department of Education [unpublished]
Proportion of children who are developmentally vulnerable on multiple domains, per cent, WA and Australia, 2009 to 2018
Source: Australian Early Development Census National Report 2018 and custom report from WA Department of Education [unpublished]
Male children are more likely than female children to be developmentally vulnerable on one or more domains. In 2018 in WA, 25.3 per cent of male children were developmentally vulnerable compared to 13.4 per cent of female children. This is consistent with the differences measured between male and female children in Australia overall (27.9% and 15.3% respectively).
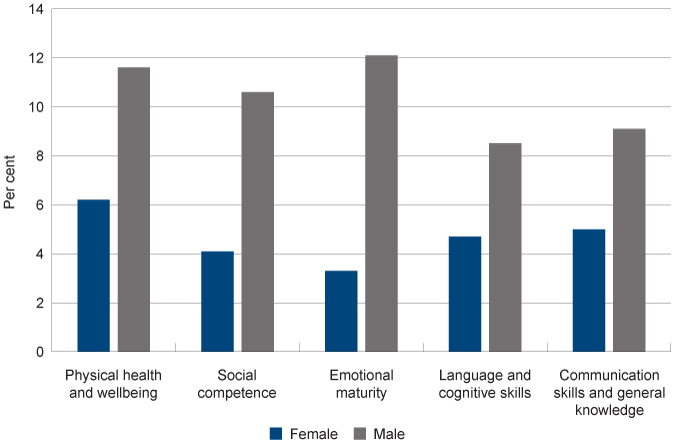
A significantly higher proportion of male than female children were vulnerable across all domains.
|
Female |
Male |
|
|
Physical health and wellbeing |
6.2 |
11.6 |
|
Social competence |
4.1 |
10.6 |
|
Emotional maturity |
3.3 |
12.1 |
|
Language and cognitive skills |
4.7 |
8.5 |
|
Communication skills and general knowledge |
5.0 |
9.1 |
Source: Custom report from WA Department of Education [unpublished]
Proportion of children who are developmentally vulnerable by domain and gender, per cent, WA, 2018
Source: Custom report from WA Department of Education [unpublished]
For more information on gender differences in the AEDC refer to the AEDC Research Snapshot – Gender.
Aboriginal children are significantly more likely to be developmentally vulnerable on one or more domains than non-Aboriginal children.
|
2009 |
2012 |
2015 |
2018 |
|||||
|
Number |
Per cent |
Number |
Per cent |
Number |
Per cent |
Number |
Per cent |
|
|
WA |
||||||||
|
Aboriginal |
1,594 |
52.3 |
2,033 |
49.0 |
2,068 |
47.5 |
2,181 |
45.2 |
|
Non-Aboriginal |
24,458 |
22.9 |
28,598 |
21.2 |
30,305 |
19.5 |
30,617 |
17.6 |
|
Total WA |
26,052 |
24.7 |
30,631 |
23.0 |
32,373 |
21.3 |
32,798 |
19.4 |
|
Australia |
||||||||
|
Aboriginal |
11,190 |
47.4 |
14,011 |
43.2 |
15,874 |
42.1 |
17,507 |
41.3 |
|
Non-Aboriginal |
235,231 |
22.4 |
258,271 |
20.9 |
270,167 |
20.8 |
275,260 |
20.4 |
|
Total Australia |
246,421 |
23.6 |
272,282 |
22.0 |
286,041 |
22.0 |
292,976 |
21.7 |
Source: Australian Early Development Census National Report 2018 and custom report from WA Department of Education [unpublished]
In 2018, nearly one-half of WA Aboriginal children (45.2%) were developmentally vulnerable on one or more domains. This is more than double the incidence for non-Aboriginal children (17.6%). Despite this figure decreasing slightly with each Census (from 52.3% in 2009, 49.0% in 2012 and 47.5% in 2015), the gap between Aboriginal and non-Aboriginal children continues to be significant.
In 2015, the biggest gap in development between Aboriginal and non-Aboriginal children was in the language and cognitive skills area where Aboriginal children were five times as likely to be vulnerable.4 Data from the 2018 Census will be provided once the WA State report has been published.
Aboriginal children are more likely to experience developmental vulnerability for a number of complex reasons. One factor is socio-economic disadvantage. Forty-two per cent of Aboriginal children participating in the AEDC in 2015 lived in communities classified as the most disadvantaged, in comparison to 10 per cent of non-Aboriginal children.5
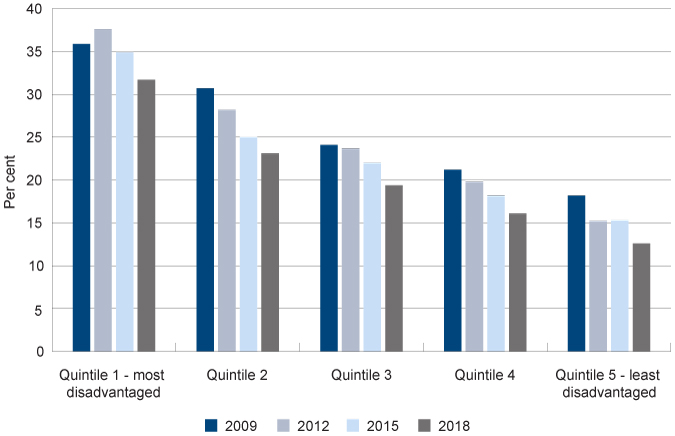
The percentage of children developmentally vulnerable on one or more domains increases with the level of socio-economic disadvantage of a community.
In WA, 31.7 per cent of children who live in communities classified in the lowest Socio-economic Indexes for Areas (SEIFA) category (Quintile 1) are considered developmentally vulnerable when they enter school compared to 12.6 per cent of children in the least disadvantaged areas (Quintile 5).
|
2009 |
2012 |
2015 |
2018 |
|
|
Quintile 1 - most disadvantaged |
35.9 |
37.6 |
34.9 |
31.7 |
|
Quintile 2 |
30.7 |
28.2 |
25.0 |
23.1 |
|
Quintile 3 |
24.1 |
23.7 |
22.0 |
19.4 |
|
Quintile 4 |
21.2 |
19.8 |
18.2 |
16.1 |
|
Quintile 5 - least disadvantaged |
18.2 |
15.2 |
15.3 |
12.6 |
Source: Custom report from WA Department of Education [unpublished]
Proportion of children who are developmentally vulnerable on one or more domains by SEIFA category, per cent, WA, 2009 to 2018
Source: Custom report from WA Department of Education [unpublished]
While there has been a welcome decrease in the proportion of children developmentally vulnerable across all five SEIFA areas, the decrease has been smaller in the most disadvantaged areas than in the least disadvantaged areas (5.6 percentage points versus 4.2 percentage points).
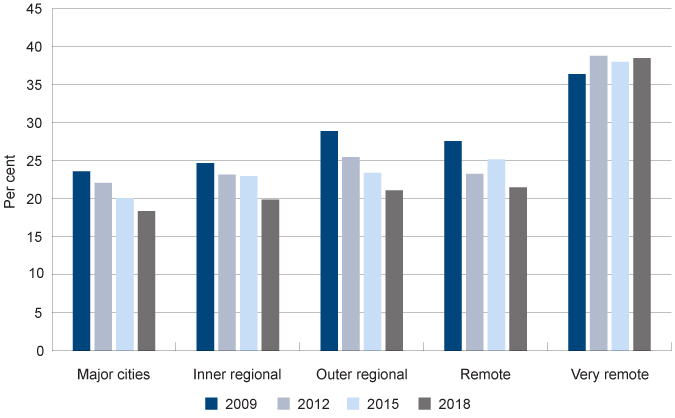
Geographic location is another important factor. In WA, 38.5 per cent of children who live in very remote areas are developmentally vulnerable on one or more domains compared to 18.4 per cent of children who live in the metropolitan area.
Very remote areas are more likely to be classified in the lowest Socio-economic Indexes for Areas (SEIFA) category (Quintile 1).6
|
2009 |
2012 |
2015 |
2018 |
|||||
|
Number |
Per cent |
Number |
Per cent |
Number |
Per cent |
Number |
Per cent |
|
|
Metropolitan |
19,157 |
23.6 |
22,780 |
22.1 |
24,279 |
20.1 |
25,354 |
18.4 |
|
Inner regional |
2,494 |
24.7 |
2,938 |
23.2 |
3,233 |
23.0 |
2,786 |
19.9 |
|
Outer regional |
2,304 |
28.9 |
2,581 |
25.5 |
2,549 |
23.4 |
2,380 |
21.1 |
|
Remote |
1,315 |
27.6 |
1,540 |
23.3 |
1,499 |
25.2 |
1,388 |
21.5 |
|
Very remote |
782 |
36.4 |
792 |
38.8 |
813 |
38.0 |
890 |
38.5 |
Source: Custom report from WA Department of Education [unpublished]
Children who are developmentally vulnerable on one or more domains by remoteness area, number of children with a valid score and per cent, WA, 2009 to 2018
Source: Custom report from WA Department of Education [unpublished]
The percentage of children developmentally vulnerable on one or more domains has decreased from 2015 to 2018 for all locations except in ‘very remote’ areas where the percentage increased (from 38.0% to 38.5%).
In summary, levels of developmental vulnerability are higher for children living in more disadvantaged and/or very remote locations, they are also higher for boys than for girls and for Aboriginal children. For more and detailed AEDC information about developmental vulnerability by domain, see the AEDC Data Explorer.
Endnotes
- Children who have turned five years of age by 30 June attend Pre-primary that year, those who turn five after 30 June attend in the following year.
- For more information on the Australian Early Development Census refer to the Australian Early Development Census website.
- Children who score above the 25th percentile (in the top 75 per cent) of the national AEDC population are classified as ‘on track’. Children who score between the 10th and 25th percentile of the AEDC population are classified as ‘developmentally at risk’. Children you score below the 10th percentile (in the lowest 10 per cent) of the national AEDC population are classified as ‘developmentally’ vulnerable’. Source: Australian Early Development Census National Report 2015, p. 8.
- WA Department of Education 2016, Early Childhood Development Census, Australian Early Development Census – State Report: Western Australia 2015, WA Department of Education, p. 26.
- Ibid, p. 21.
- Australian Bureau of Statistics 2018, 2033.0.55.001 - Census of Population and Housing: Socio-Economic Indexes for Areas (SEIFA), Australia, 2016, IRSAD Interactive Map [website].
Last updated March 2020
In the past, the AEDC has been criticised for pointing to the negative implications of identifying communities as vulnerable rather than highlighting their strengths.1 The Multiple Strengths Indicator (MSI) focuses on the strengths that children have developed by the time they start school. The MSI measures developmental strengths in social and emotional development which include advanced literacy skills, a particular interest in reading, numeracy and memory, and good communication skills.
The MSI is calculated using 39 questions selected from the Australian version of the Early Development Instrument (AvEDI) that captures AEDC data and has a particular focus on more advanced skills and competencies across the five domains. Children with valid scores are classified into one of the following three categories:
- Highly developed strengths: children are likely to be on track and show strengths across all five AEDC domains;
- ‘Well developed strengths’: children show strength in 50 to 70 per cent of skills;
- ‘Emerging strengths’: children may be meeting developmental expectations when they start school but do not exhibit a high number of strengths.
Children can exhibit strengths as well as vulnerabilities in their development and the MSI provides a different (strengths-based) perspective on a child’s development at school entry. Seventy five per cent of children that are classified as developmentally vulnerable on one or more domains fall into the ‘emerging strengths’ category and 25 per cent are in the ‘well developed’ or ‘highly developed’ category. Around 95 per cent of children who show developmental vulnerability across two or more domains are in the ‘emerging strengths’ category.2
MSI data is only provided at the community level and is not aggregated. Communities can use the information provided by the MSI in addition to the other indicators to inform service planning. See below for examples of Multiple Strengths Indicator 2018 Community Summaries.
|
SEIFA score |
Highly developed strengths |
Well developed strengths |
Emerging strengths |
||||
|
Index* |
Number |
Per cent |
Number |
Per cent |
Number |
Per cent |
|
|
Cambridge |
1,114 |
299 |
72.2 |
79 |
19.1 |
36 |
8.7 |
|
Wanneroo |
1,015 |
1,660 |
55.2 |
704 |
23.4 |
644 |
21.4 |
|
Gosnells |
987 |
918 |
50.1 |
497 |
27.1 |
416 |
22.7 |
|
West Kimberley |
726 |
41 |
31.1 |
35 |
26.5 |
56 |
42.4 |
|
WA |
N/A |
18,154 |
55.2 |
7,909 |
24.1 |
6,819 |
20.7 |
|
Australia |
N/A |
169,053 |
57.5 |
64,058 |
21.8 |
60,640 |
20.6 |
Source: AEDC community profiles
* ABS 2017 SEIFA Index of Relative Socio-economic Disadvantage by Local Government Area. The lower the number the higher the level of disadvantage.
Cambridge, Wanneroo and Gosnells provide examples of results from communities located in areas of low and middle socioeconomic disadvantage within the Perth metropolitan area, while the communities in the West Kimberley are living with very high socioeconomic disadvantage.
Consistent with the AEDC data on vulnerability, children living in areas with higher levels of disadvantage are less likely to be developmentally ‘on-track’ when they start school. Conversely, children living in areas with lower levels of socioeconomic disadvantage are more likely to exhibit highly developed strengths when they start school and are less likely to be classified in the ‘emerging strengths’ category.
Endnotes
- Atelier Learning Solutions 2010, Evaluation of the Australian Early Development Index: Desktop analysis, Department of Education, Employment and Workplace Relations, p. 43.
- For more information on the Multiple Strength Indicator refer to the Understanding the Multiple Strength Indicator fact sheet.
At 30 June 2019, there were 1,341 WA children in care aged between 0 and four years, more than one-half of whom (56.8%) were Aboriginal.1
It is well established that children in care are some of the most vulnerable in our community.2 Exposure to abuse or neglect in early childhood can impair cognitive abilities and learning opportunities and is strongly associated with a high level of developmental risk.3
A WA study linking child protection data with AEDC data found exposure to substantiated or unsubstantiated childhood maltreatment was associated with an increased risk of developmental vulnerability at age five. Substantiated maltreatment was associated with poor social and emotional development in children, regardless of the type or timing of the maltreatment. Further, children with unsubstantiated maltreatment were also at risk of poor school readiness.4
This study found that a single allegation of maltreatment - including unsubstantiated allegations - were associated with physical, emotional, social, communicative, and cognitive difficulties at the start of school, highlighting that appropriate support services for the family should be arranged as soon as the Department of Communities is contacted.5
The Early Years Education Program (EYEP) is a centre-based, early years care and education program being trialled in Victoria which targets the needs of children who are exposed to significant family stress and social disadvantage, including being at heightened risk of, or having experienced, abuse and neglect. The children participating in EYEP are less than three years of age at entry to the trial and are offered three years of intensive, high quality care and education.6
At 24 months of enrolment the study reports significant positive impacts on the ‘children’s cognitive and non-cognitive development – primarily IQ, protective factors related to resilience and social-emotional development. There is also some evidence that EYEP improves children’s language skills and lowers the psychological distress of their primary caregivers’.7
Endnotes
- Department of Communities 2019, Annual Report: 2018-19, WA Government p. 26.
- Osborn A and Bromfield L 2007, Outcomes for children and young people in care, National Child Protection Clearinghouse Brief No. 3, Australian Institute of Family Studies.
- NSW Family and Community Services 2018, Evidence to Action Note: Child maltreatment in early childhood – developmental vulnerability on the AEDC, NSW Government.
- Bell M et al 2018, School readiness of maltreated children: Association of timing, type, and chronicity of maltreatment, Child Abuse & Neglect, No 76.
- Ibid.
- Tseng Y et al 2019, Changing the Life Trajectories of Australia’s Most Vulnerable Children: Report No. 4 - 24 months in the Early Years Education Program: Assessment of the impact on children and their primary caregivers, The University of Melbourne et al, p. 3.
- Ibid.
The Australian Bureau of Statistics Disability, Ageing and Carers data collection reports that approximately 5,200 (3.1%) WA children and young people aged 0 to four years have a reported disability.1 Furthermore, approximately 3,900 children in this age group are living with ‘profound or severe core activity limitation’ which indicates that a person is unable to do, or always needs help with, a core activity task.2
No data is available on the readiness for learning of WA children with disability.
The most common types of disability identified for children aged 0 to four years are sensory and speech (2.7% of all children of that age), intellectual disability (1.1% of children of that age) and physical disability (1.0% of children of that age).3
The five domains used by the AEDC to determine developmental vulnerability are physical health and wellbeing, social competence, emotional maturity, language and cognitive skills (school-based), and communication skills and general knowledge. Children with disability may often experience vulnerabilities in these areas as a result of their disability and due to their experiences with other children, adults and organisations (including Kindergartens and Schools).
The Australian Bureau of Statistics report that nearly one-half of Australian children with disability attending school reported learning difficulties (48.7%) and over one third had difficulties fitting in socially (38.8%).4
While there is limited research on disability and developmental vulnerability, recent research found that children with ‘reported hearing loss had over double the odds than their hearing peers of being developmentally vulnerable on one or more domains of the AEDC’.5
Data for children with disability is not reported in the published AEDC results. However, Table 4 of each Community Profile provides data on the number of children with special needs in a particular community.6
In a recent submission to the Federal Government, Children and Young People with Disability Australia contend that failing to collect and report on data for children with disability results in a ‘failure to measure, define and acknowledge’ the experiences of children with disability.7
Endnotes
- Australian Bureau of Statistics 2020, Disability, Ageing and Carers: 2018, Western Australia, Table 1.1 Persons with disability, by age and sex and Table 1.3 Persons with disability, by age and sex, proportion of persons.
- Estimates are to be used with caution as they have a relative standard error of between 25 and 50 per cent. Australian Bureau of Statistics 2020, Disability, Ageing and Carers: 2018, Western Australia, Table 3.1 All persons, disability status, by age and sex–2018, estimate.
- Australian Bureau of Statistics (ABS) 2020, 4430.0 - Disability, Ageing and Carers, Australia: 2018, Table 3.3 Children aged 0-14 years with disability, living in households, Disability group by Sex and Age – 2018, ABS.
- Australian Bureau of Statistics (ABS) 2020, 4430.0 - Disability, Ageing and Carers, Australia: Summary of Findings, 2018, Children with Disability, ABS.
- Simpson A et al 2020, Developmental vulnerability of Australian school-entry children with hearing loss, Australian Journal of Primary Health, Vol 26.
- For help in understanding AEDC results or to request further information, visit www.aedc.gov.au/about-the-aedc/how-to-understand-the-aedc-results
- Children and Young People with Disability Australia 2018, Submission to Department of Social Services - Stronger Outcomes for Families Discussion Paper June 2018, Children and Young People with Disability Australia.
The assessment of a child’s readiness for school involves the combined consideration of children’s strengths and vulnerabilities (provided by measures such as the AEDC) and the individual literacy and numeracy skills the child brings to school. This is discussed further in the Transition to school indicator.
The AEDC provides a population-based picture of children’s development and the results are used by government, schools and communities to inform priorities, programs and policies relating to child development. Preliminary research findings from the Telethon Kids Institute which link AEDC and NAPLAN results, indicate that a child’s level of school readiness (measured through the AEDC) can predict future learning outcomes.1
A child’s readiness for school and learning is developed by a combination of nurturing, safe and stimulating home and community environments; accessible and culturally safe family services; and engagement in high quality early childhood education and care. Through these processes children develop physical, socio-emotional, behavioural and cognitive strengths. These basic building blocks support a child’s health and wellbeing and enable them to start school with the best possible chance of success.
Aboriginal students are less likely to be ‘ready’ for primary school than non-Aboriginal students.2 As a group, Aboriginal people experience widespread socioeconomic disadvantage and health inequality and the AECD data shows that disadvantage in wellbeing outcomes starts from an early age. Furthermore, research suggests that a ‘lack of readiness’ is not a problem of the child, but can represent the inability of some schools or ECEC providers to engage with Aboriginal children in a culturally safe manner.3
Data gaps
No data or research exists on the learning readiness of WA children in care or children with disability.
Longitudinal research exploring how early learning programs influence outcomes for children with developmental vulnerabilities would be beneficial to provide a better understanding of the scope and quality of care provided to children and what supports are needed to assist their carers.
Endnotes
- Brinkman S et al 2014, Research Snapshot: Predictive validity of the AEDC – Predicting later cognitive and behavioural outcomes, Telethon Kids Institute and Commonwealth of Australia.
- Kulunga Research Network of Telethon Kids Institute 2007, National Indigenous education: an overview of issues, policies and the evidence base, Australian Research Alliance for Children and Youth, p. 10.
- Dockett S et al 2010, School readiness: what does it mean for Indigenous children, families, schools and communities? Issues paper No. 2, Closing the Gap Clearinghouse, Australian Institute of Health and Welfare and Australian Institute of Family Studies.
For more information on readiness for learning refer to the following resources:
- Brinkman S et al 2014, Research Snapshot: Predictive validity of the AEDC – Predicting later cognitive and behavioural outcomes, Telethon Kids Institute and Commonwealth of Australia.
- Dockett S et al 2010, School readiness: what does it mean for Indigenous children, families, schools and communities? Issues paper No 2, Closing the Gap Clearinghouse, Australian Institute of Health and Welfare and Australian Institute of Family Studies.
- Marmor A and Harley D 2018, What promotes social and emotional wellbeing in Aboriginal and Torres Strait Islander Children, Australian Institute of Family Studies.
- Pascoe S and Brennan D 2017, Lifting our game: Report of the review to achieve educational excellence in Australian schools through early childhood interventions, Victorian Government.


